See the site. Understand the wind.
A wind-farm workflow combines the surveyed landscape with atmospheric measurements and selected operating data. Ground-based wind LiDAR describes the wind at defined heights; a met station or mast provides reference observations. Nacelle LiDAR measures upstream of a turbine for a different assessment task. Software brings these records together without treating them as the same measurement.
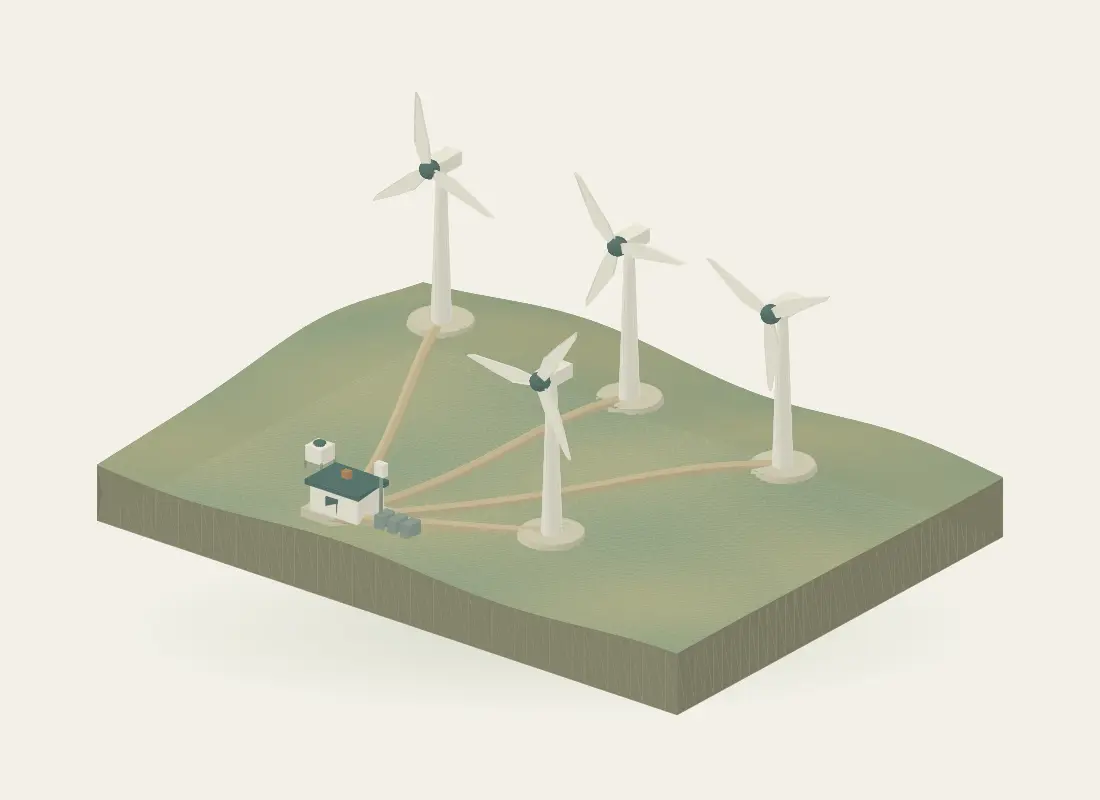
Explore the same site in the interactive experience.
Capture terrain and asset context
Use a suitable aerial or terrestrial survey to document terrain, access routes and existing assets. Scope coordinate control, coverage and outputs before capture. The representative aerial sequence on this site illustrates a workflow, not a flight plan or proof that all occluded surfaces can be captured.
Specify the measurement campaign
Define the heights, averaging periods, campaign duration and availability checks needed for the assessment. Ground-profiler observations, mast measurements and nacelle upstream observations have different locations and sampling geometries. Instrument compatibility, siting, power, communications and calibration arrangements belong in the campaign plan.
Align observations with operating records
Compare reviewed wind observations with selected power or equipment data through agreed interfaces. Preserve timestamps, missing-data flags and measurement boundaries. Resource assessment, performance assessment and closed-loop turbine control are different scopes; a dashboard connection does not establish a control capability.
Inputs to agree
- Terrain and asset extent, access and survey-control requirements
- Measurement heights, averaging periods and campaign objectives
- Reference instruments, calibration records and data-availability criteria
- Agreed turbine or site-output interfaces and review boundaries
Possible outputs
- Survey context, terrain surfaces or as-built asset records
- Wind profiles with height and sampling metadata
- Quality-aware time-series views with selected operating records
- Campaign or operational reports scoped to the assessment
Keep the measurements distinct
| Quantity | Unit or component | Interpretation |
|---|---|---|
| Profiler height | m above ground | Vertical measurement reference. |
| Nacelle upstream distance | m ahead of the instrument | Distance along the upstream measurement geometry. |
| Mean wind speed | m/s over a defined period | Not the variability statistic needed for turbulence intensity. |
Is a 100 m profiling height the same as measuring 100 m ahead of a turbine?
No. Profiling height is a vertical reference above ground. An upstream distance from a nacelle instrument is a different spatial reference. Both the instrument location and the measurement geometry must accompany the value.
Can the displayed wind speeds establish annual energy yield or turbulence intensity?
No. The illustration contains hourly samples of synthetic mean values. Annual yield needs an appropriate resource and turbine assessment. Turbulence intensity requires suitable variability statistics and measurement/reconstruction context; it cannot be recovered from a handful of mean-speed samples.
Technical references
Further reading on the measurement principles discussed above.
Content reviewed · Skyrover